> ## Documentation Index
> Fetch the complete documentation index at: https://docs.chaintable.com/llms.txt
> Use this file to discover all available pages before exploring further.
# Query token daily transfers
> Filter existing Ethereum token transfer data for USDC and count transfer records by day.
This tutorial queries the existing `token.token_transfer.eth` table to count daily USDC transfers on Ethereum mainnet.
## 1. Create a query
Sign in to the [Chaintable console](https://chaintable.com/spaces) and open your Space. This example uses `demo`.
Open **Queries**, click **+** in the upper right, name the query `USDC daily transfers`, and click **Save and open**.
## 2. Enter SQL
```sql theme={null}
SELECT
CAST(block_timestamp AS DATE) AS day,
COUNT(*) AS transfer_count
FROM token.token_transfer.eth
WHERE token_id = '0xa0b86991c6218b36c1d19d4a2e9eb0ce3606eb48'
AND block_timestamp >= TIMESTAMP '2026-09-01 00:00:00'
AND block_timestamp < TIMESTAMP '2026-09-08 00:00:00'
GROUP BY 1
ORDER BY 1
```
The query:
1. Filters for USDC using `token_id`.
2. Selects records from September 1 through 7, 2026, excluding the September 8 boundary.
3. Converts block timestamps to dates and counts transfer records with `COUNT(*)`.
4. Sorts dates in ascending order.
The example groups dates in UTC. Change both time boundaries to query another period.
## 3. Run and save
Click **Run** and wait for **Query results**. Click **Save** at the top to save your changes. You can reopen the query and run it again.
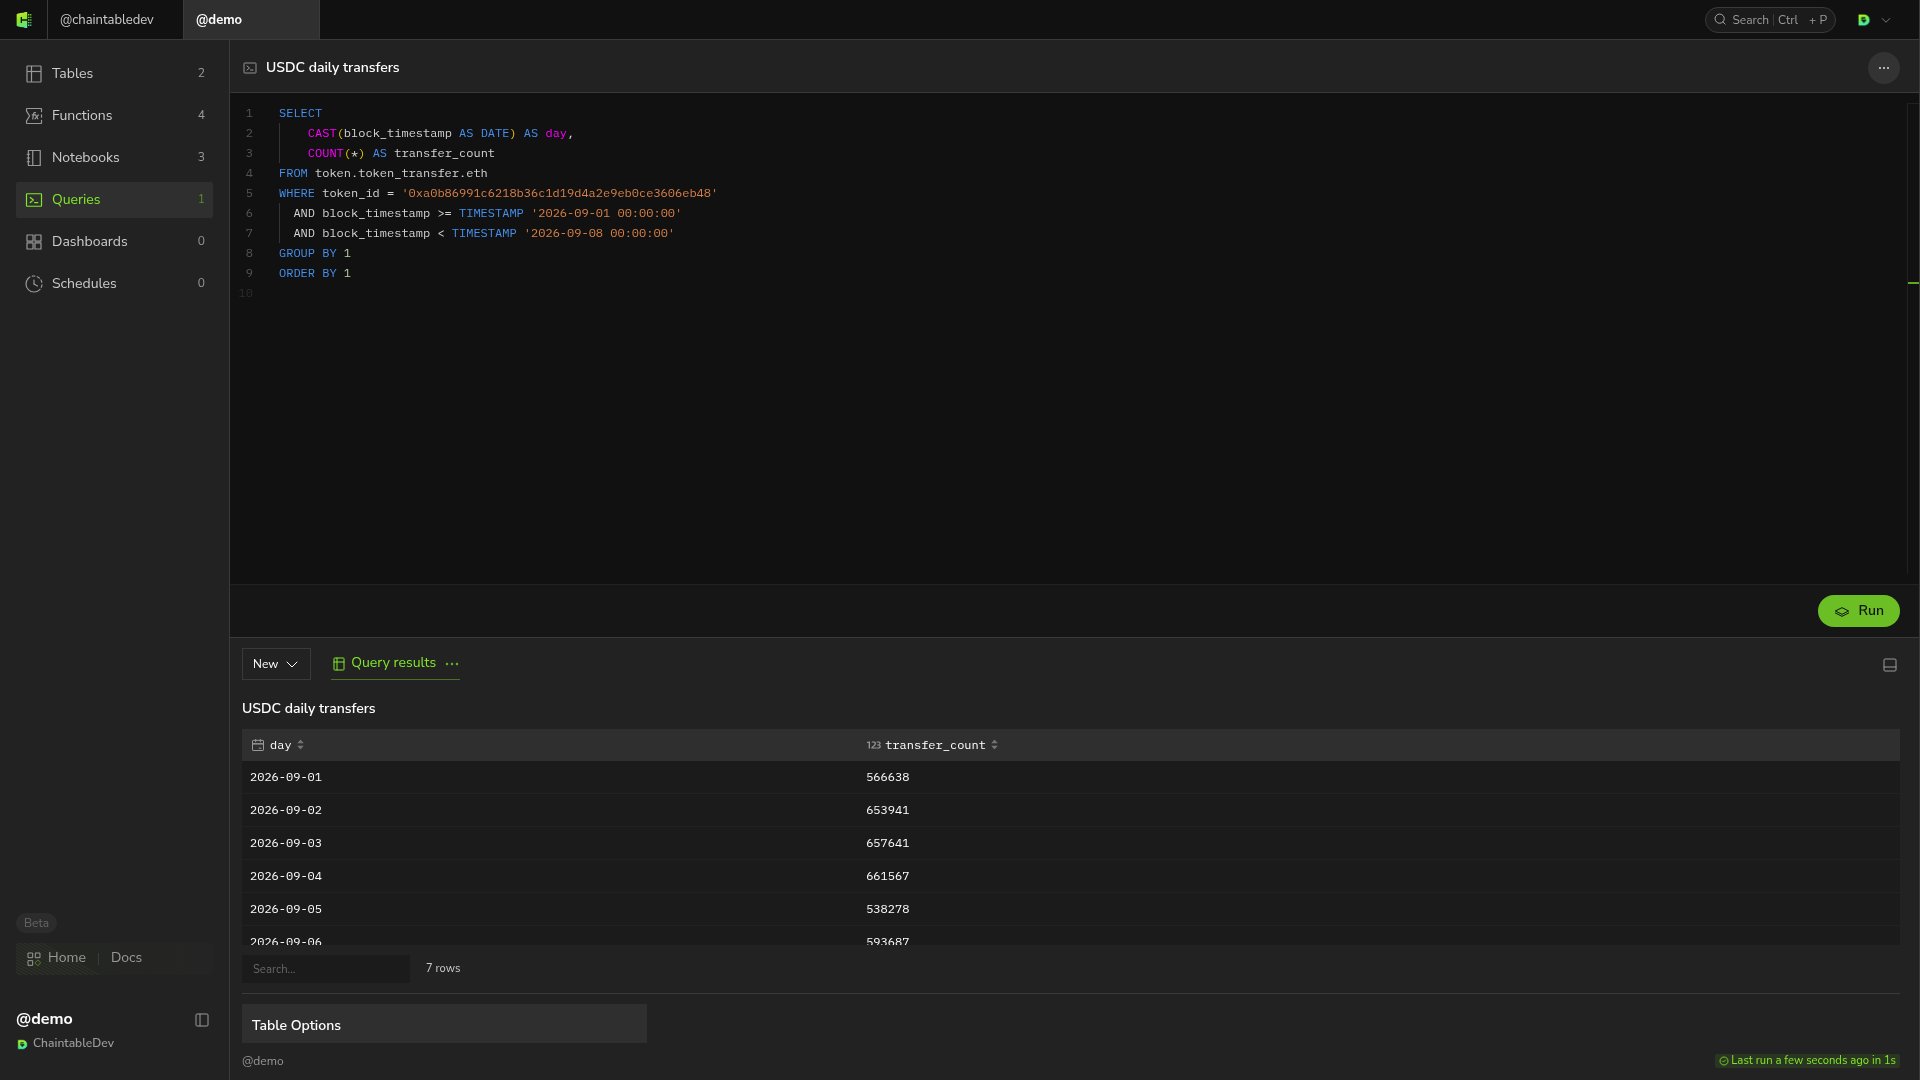 The query returns seven rows, one for each day from September 1 through 7.
## 4. Show the trend
In the results area, select **New → Bar Chart** and open the new chart tab. Set **X Column** to `day` and **Y Column 1** to `transfer_count`.
See [Visualizations and dashboards](/guides/analytics/visualizations-and-dashboards) for chart configuration and adding a chart to a dashboard.
The query returns seven rows, one for each day from September 1 through 7.
## 4. Show the trend
In the results area, select **New → Bar Chart** and open the new chart tab. Set **X Column** to `day` and **Y Column 1** to `transfer_count`.
See [Visualizations and dashboards](/guides/analytics/visualizations-and-dashboards) for chart configuration and adding a chart to a dashboard.